Sports Science Projects
As discussed on the Org Review section:
"On these topics, I was to work closely with the existing Analytics and Sports Science divisions to bring our capabilities up to speed. The analysts were excited about the new direction that was set, as previous leadership in Pitching Development did not take a data-driven approach to coaching their players."
Unfortunately, our Sports Science division was overworked and underfunded for all the initiatives that the department was hoping to carry out - we were undergoing a switch from SIMI Motion Systems to Kinatrax, we had an org-wide force plate initiative rollout to support, a large Virtual Reality hitting development project, and a huge amount of COVID-19 testing and overhead related to the pandemic. Our Sports Science department was small and also had to do a considerable amount of data collection and operational work, meaning there was very little bandwidth for new projects to be added to the docket.
Given my experience of working in Sports Science and the significant technology deficit we faced against the best organizations, I sought and received permission to oversee Sports Science initiatives for the pitching department, promising that initiatives would come out of our budget.
I quickly considered which initiatives we wanted to accomplish during my two year contract, pandemic season and all. After discussing with Eric Jagers, Caleb Cotham, and my staff, we settled on the following four initiatives in descending order of importance:
- Marker-Based Motion Capture for Assessments, Rehab, and Skill Development
- Using PULSE Wearables to Track Workload
- Pairing Biometric Wearable Data to Injuries/Performance Markers
- Effective Reports Around Existing In-Game Markerless Motion Capture
After years of coaching athletes using precise motion capture data and knowing how valuable it could be at giving our coaches objective data to help coach our athletes, I didn't want to go without it. However, our budget for an initiative like this had to come out of the pitching department's budget, as there was no discretionary money available from Sports Science. Our entire budget for all initiatives we wanted had to come in below $100,000. That meant figuring out how we could afford to buy a highly-precise motion capture system, contract a third party to process the data that came out of said system, and purchase wearables to track pitching-specific workload - all for just about $90,000.
Labor for everything else would have to be on our own, and I'd have to train our workforce to be highly-skilled technical experts who could run a motion capture system every day, use two types of wearable technologies without the help of Sports Science interns, and use the reporting system that I would have to develop on my own to get all four initiatives done inside two years - which quickly became one year given that we had no direct access to players during the pandemic. I didn't know of any pitching coaches that operated a motion capture lab - it didn't even happen at Driveline Baseball; dedicated biomechanists and interns did the marker placement, camera calibration, set-up / deconstruction, and data collection. It was a lot to ask of a staff - but we felt that we needed it to get the best results for our athletes. And if we could get everything under budget, then the only roadblocks in our way would be long hours for the coaches, very long hours for the coordinators, and a lot of work developing software and training programs for our staff.
I spoke to my father - a lifelong electrician, construction worker, and blue collar man - about the task at hand in general terms. He kept his advice fairly simple: "If all it takes to achieve your goals are long hours and hard work, you've run out of excuses."
It was time to get to work.
Marker-Based Motion Capture
We had eight Optitrack Prime-series cameras in storage due to a previously existing VR hitting system that used this system, which seriously cut down on the expense for this operation. I knew that I could train my coaches to marker up our pitchers with enough precision, but processing the data would be out of our league. I was able to cut a deal with Driveline Baseball, paying the company for training services, leasing four more Prime-series cameras, and contracting them to process up to 200 trials, which would include raw data, kinematic/kinetic reports, and drill score sheets to provide automated pitching mechanics recommendations for our coaches and athletes. I was able to repurpose an existing high-powered laptop under IT's control to run the capture software, and combined with my repurposed Reds-issued laptop and desk monitors, we had enough to set up a motion capture system in our minor league cages:
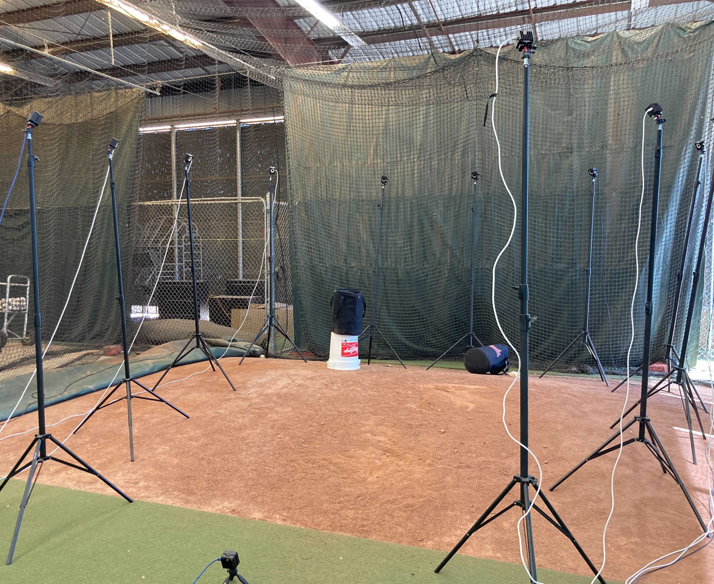
We were able to get the cost down by agreeing to be responsible for all of the data collection and ensuring that we submitted it pre-cleaned and labeled. To achieve this, we trained our coaches every other day after-hours in Spring Training early camp until we got the error down to sub-millimeter accuracy and the file structure exactly correct. I wrote extensive training documentation, and three of our pitching coaches voluntarily took the lead at becoming expert operators of the motion capture system.
The system began to run with our minor leaguers reporting to main April camp, breaking up their bullpens and Live BP sessions in waves so we would get 90%+ coverage with 3-8 pitchers going every day. They would throw their standard bullpen in the cage, strip down, get markered up, and finish with 5-10 fastballs in the motion capture system. To ensure we had high output in these sessions which was required for accurate data and useful reports - something notoriously tough to do in a lab-based setting - we had pitchers submit their song requests ahead of time in Slack, and we'd play it over the cage's loudspeakers just as they were about to get going. We'd also keep track of velocities and kept a leaderboard going to create the competitive spirit on an individual and team level.
In the end, we were able to get the collection time down to 15 minutes per pitcher about halfway through camp, and Driveline turned around the reports within 3-5 days, after which the coaches/coordinators began taking turns sitting down with the athletes going over their biomechanical data in scheduled one-on-one meetings.
We would take the motion capture reports and go into as much detail as each pitcher wanted - most wanted just a brief review of the technical reports, but some wanted highly technical explanations, which were usually referred out to the coaches with more experience with motion capture systems. While many preferred brevity when it came to the reports, all of the athletes were very interested in the automated recommendations. That didn't make the processed data unimportant - a computer that spits out suggested mechanical changes is a tough pill to swallow unless the coach can explain the system's recommendations and furthermore show why the system is making those recommendations. The athlete didn't necessarily care about the nuts and bolts of the engine, they just want to know that there's something behind these recommendations and that the coach understands it and believes it will help their career.
Therefore, training our coaches to be able to understand the system's complex outputs and the simple recommendations really mattered.
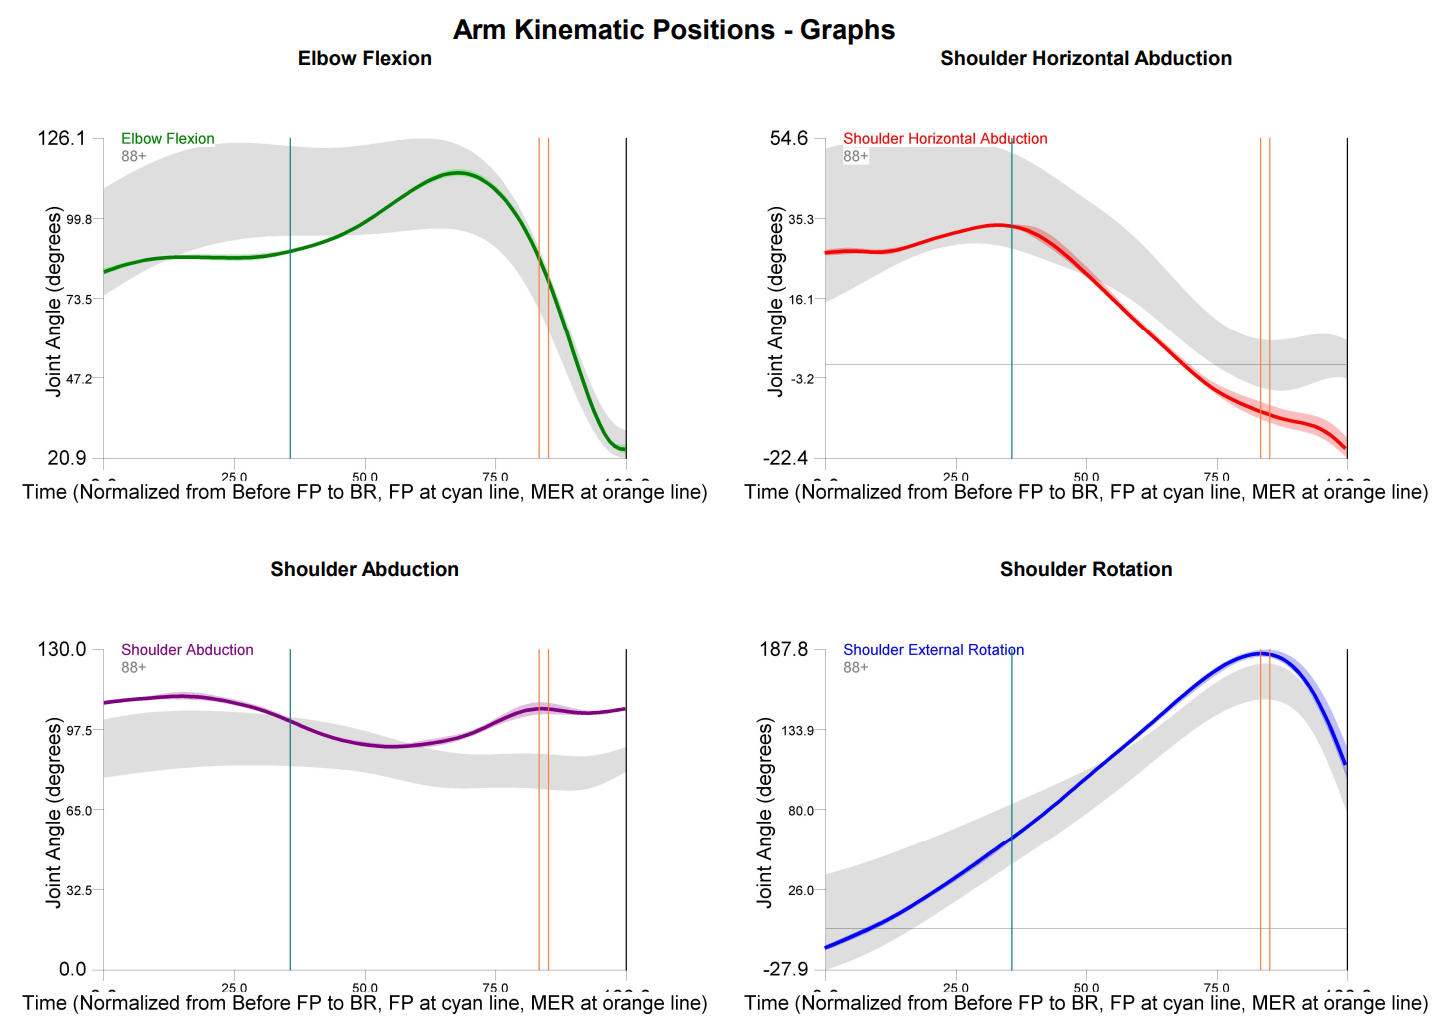
For the example athlete above, we would pair that report with the drill scores and explanations that come with it. In this athlete's case, we were primarily focused on upper body kinematics/kinetics as key areas of improvement for a more efficient method of transferring force up the kinetic chain. The natural language engine - based on a large database of elite pitchers throwing 88+ MPH in a motion capture setup - produced this feedback:
- Arm action has a few inefficiencies. Early forearm flyout, elbow flexion has room to be more constrained. Lack of scap retraction at foot plant.
- Elbow hikes up a bit high at foot plant and stays high through ball release. Slightly over-extends and reaches out in front of his body at release.
- Below average elbow flexion at foot plant (89 degs). High shoulder abduction at foot plant (101 degs).
- High shoulder abduction at ball release (106 degs). Below average shoulder horizontal abduction at foot plant (33 degs).
- Higher than average shoulder horizontal abduction (arm extending out in front of torso) at ball release (-20 degs).
- Below average max shoulder horizontal abduction (max shoulder horizontal abduction of 34 degs).
If we just turned that over, the athlete would be confused - and rightfully so! But by showing them the graphs (processed data), a system-based explanation of the data in highly technical terms (natural language engine), the coach's interpretation of the graphs + explanation (human touch), and finally, the recommended "drill scores" (automated system that produced weights for constraint-led drills), the athlete could grasp why the output was important, and what to do about it.
Example drill score outputs for the athlete above were:
- Pivot Pickoffs: 6
- Scap Retraction: 8
- Roll In Throw: 3
- Foot Up Rocker: 0
Weights are assigned a value from 0 to 10; the larger the number, the more important the system thinks the drill is for the athlete's given profile. This allowed us to tweak throwing programs' volume and intensity in a very individualized format without having to do a ton of extra work - the motion capture output produced a ton of the guidance for us. Athletes could get as deep in the weeds as they wanted with this information or they could get a very simple overview of the data with suggested modifications to their throwing program. I've had meetings that lasted over an hour with highly intelligent and inquisitive athletes, and I've had equally productive meetings that lasted five minutes. The athlete in question above was an example of the latter; I simply sat him down, leafed through the graphs/system recommendations to show him I wasn't making up ideas about his pitching mechanics, and showed him the drill scores with my thoughts on how we could tweak his throwing program to make mechanical changes without needing to obsessively focus on them in bullpens. He asked one or two simple follow up questions, and after I answered them and he had nothing else, we ended the meeting. He was excited to have a simple roadmap to follow for the remainder of the year.
That pitcher ended up being one of our greatest development stories this year. His arm action changed over the year until it was much smoother, had better connection with his torso rotation, and with better direction to home plate, which produced a much more spin efficient fastball (removed the cut from his fastball), at higher velocities, better carry, and greater extension towards home plate.
Using PULSE Wearables to Track Workload
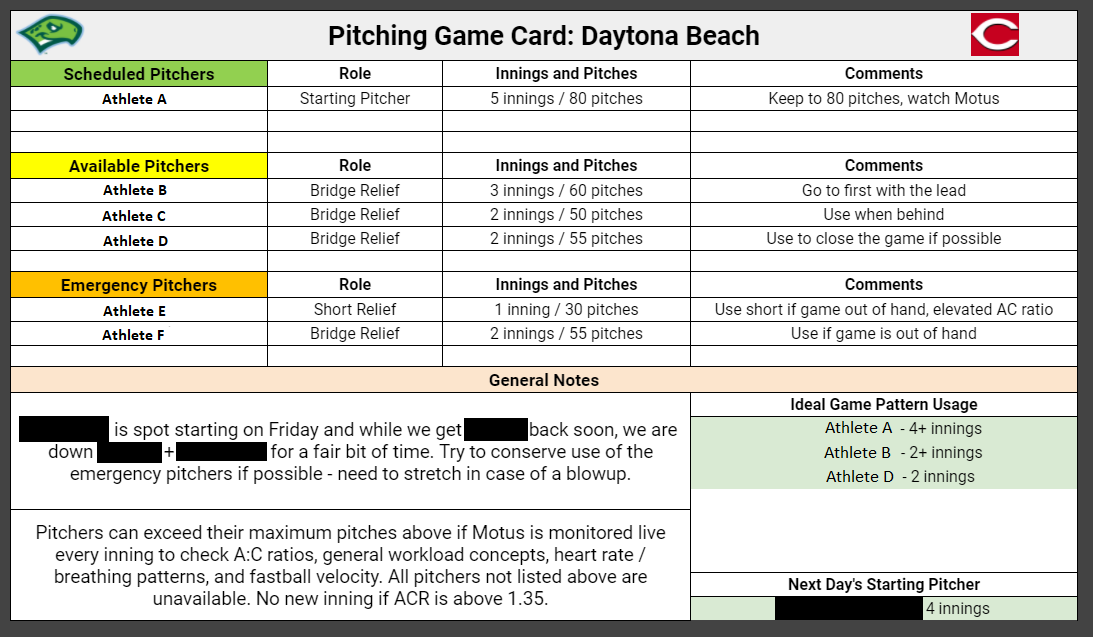
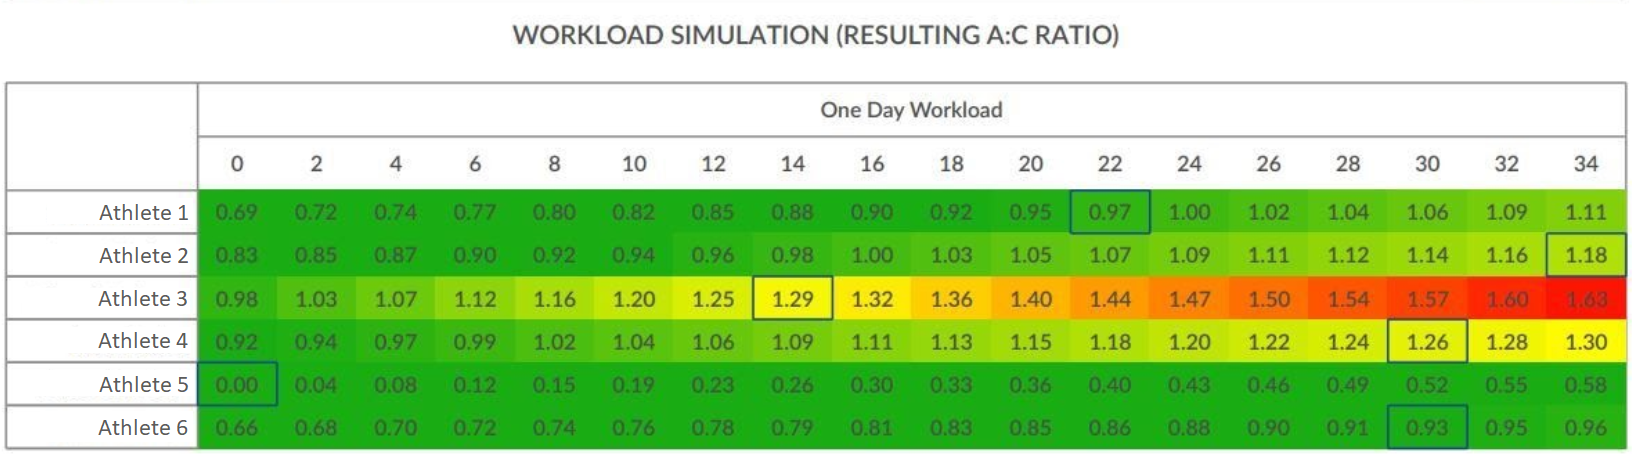
This particular use case was covered on the Driveline Baseball Blog - How The Cincinnati Reds Used PULSE to More Effectively Manage Their Pitching Staff. We used the workload estimator / programming tool extensively at both A-Ball levels and found a ton of value in it. For more information, visit the blog link above.
Pairing Biometric Wearable Data to Injuries/Performance Markers
The Sports Science department offered Oura rings for everyone on the 40-man roster in addition to the majority of the minor leaguers reporting in April (main camp). About half of our minor league pitchers took them up on the offering, with around half of that number actually maintaining compliance with usage - an area we could have significantly improved if the pitching department had taken greater initiative around this (one of our early mistakes - not getting involved with other departments to help bolster their projects to increase buy-in).
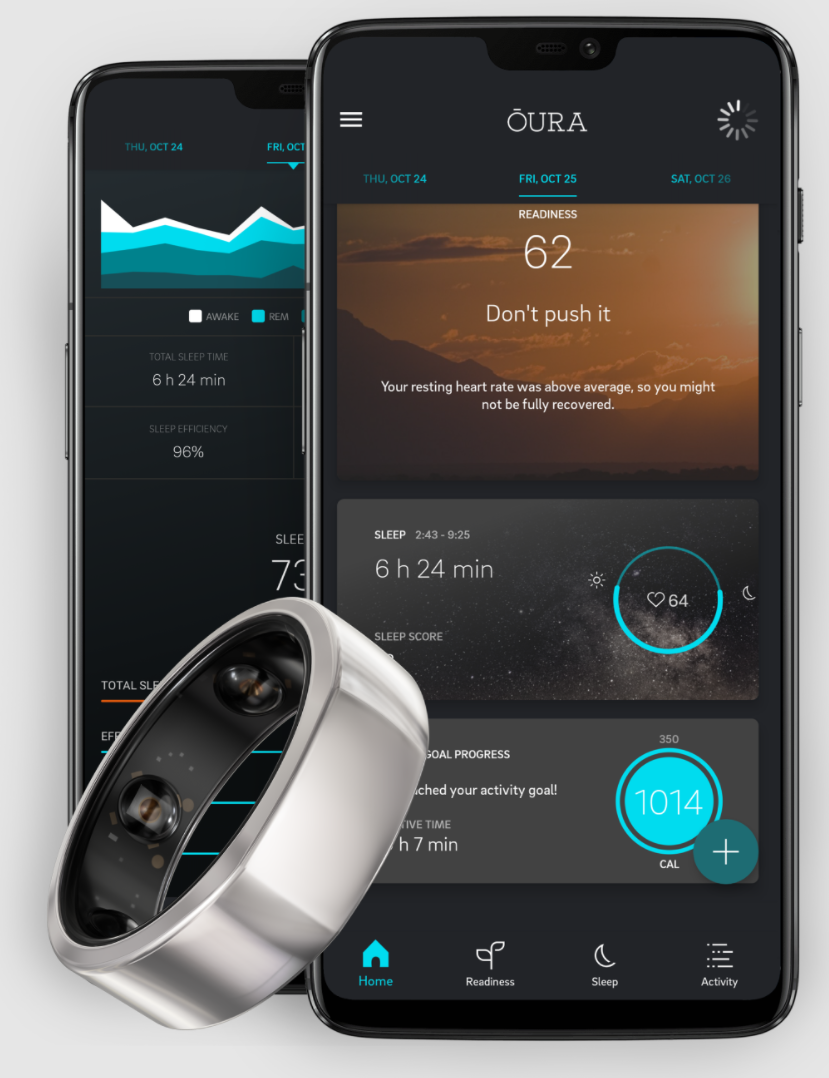
After two months of our pitchers wearing the Oura ring and not receiving any reports from our Sports Science department, I decided to ask the leadership in Sports Science if I could get the raw data in CSV/SQL format and run some reports on our own. Deluged with operational work, the Sports Science team turned over data on an ongoing basis. After studying the raw data and writing a few parser scripts to transform and load the data into our department's database, I built a few regular reports that would run weekly to give me summary data on recovery, sleep, and other metrics for our pitchers. In doing so, I could help notify the coaches which pitchers could benefit from sleeping more hours, adjusting their routine to potentially get more REM/Deep sleep (using ear plugs, eye masks, and taking NSF-approved supplements all went a long way here).
It was important we kept the trust of the athletes and didn't take negative approaches on getting them to sleep more; every MLB team has people extolling the virtues of sleeping more, with very little impact. What we'd need wasn't just the same old research, but rather individual impact proving there was something behind improving their quality and quantity of sleep. We'd find it after about a month of reviewing reports and running correlations between Stuff+ breakouts (1+ SD of improvement), time on the Injured List (IL), and the Oura ring recovery scores. Green dots below indicate the Stuff+ breakouts while the red dots indicate a player who hit the Injured List in 2021:
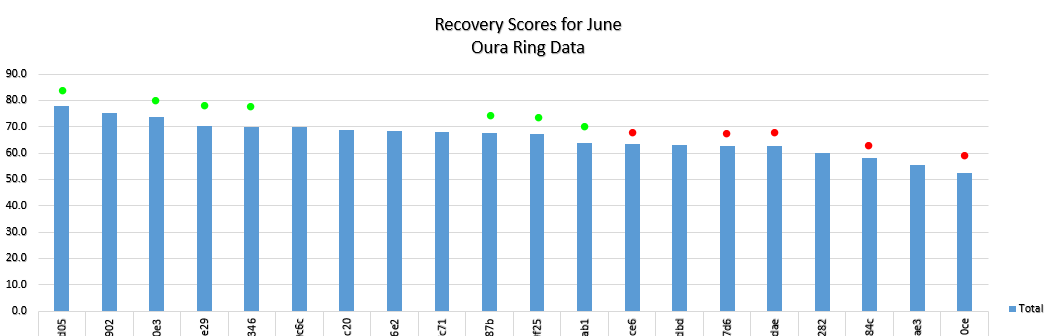
The data frankly looked manufactured, but it was real - and the trends held up over the remainder of the season (though it thankfully settled into a much more reasonable distribution, rather than something that looked completely faked). Showing the pitchers this data had a stark and immediate impact - players who were in non-compliance with wearing their Oura ring suddenly had a lot more interest in getting on it; pitchers who slept poorly started asking the players who took sleep more seriously for their habits. Like all successful player development initiatives, when the players start policing the behavior and pressuring each other into good decisions, you start to see the results you want.
Reporting on Kinatrax Motion Capture
We had Kinatrax installed in both Great American Ballpark as well as our Arizona Complex League Field 1, and collecting the data from both systems was going smoothly enough. Our R&D department ran comparisons of Kinatrax vs. our marker-based data (not true A:B test since they happened at different times), and we got a list of metrics that we could compare between both systems - and what our reporting could be built around.
Dan Aucoin would develop the first monitoring reports to note significant changes to the metrics we cared about - the reports would be used primarily in the big leagues for addressing chronic changes to pitching mechanics. With Dan's departure from the Reds, the initiative more or less fell by the wayside, though tooling around markerless data has been continued by the R&D team at Driveline Baseball, and is an offering that will be launched for 2022 - compatible with both Kinatrax and Hawkeye units.